This post walks you through setting up Prometheus and Grafana to monitor your Proxmox cluster. You’ll be able to see how your VMs and containers are performing, catch problems early, and optimize your resource allocation.
Who should follow this guide?
This guide is ideal for those who are already comfortable with Proxmox and want to add a monitoring layer to their setup. Basic understanding of Linux concepts and familiarity with navigating the command line will be helpful.
The setup#
I’m going to setup my monitoring in a way that I don’t have to install anything on my Proxmox nodes. Instead, I will install the complete monitoring stack on one of the VMs running in my cluster. Like in the following diagram, I’ll have an AlmaLinux server running in my cluster that will host the following:
- Prometheus Server
- Grafana
- Prometheus VE Exporter
 flowchart LR; PV1[PVE1]-->PE[PVE Exporter]; subgraph ide1
[AlmaLinux VM] PE[PVE Exporter]-->PS[Prometheus Server] --> G[Grafana] end
PV2[PVE2]-->PE PV3[PVE3]-->PE; PV4[PVE4]-->PE; style ide1 fill:#888
stroke:#000,stroke-width:4px,stroke-dasharray: 5 5
Security Considerations:
While the guide demonstrates the configuration process, it’s important to note that the example uses a weak password for Prometheus.
Introducing the Tools:#
Prometheus:#
An open-source monitoring system that acts like a central collector, scraping metrics from various sources like Proxmox VE at regular intervals and storing them in a time-series database.
Grafana:#
An open-source platform for visualizing data. It allows you to create interactive dashboards that display the metrics collected by Prometheus, making it easy to understand resource utilization, identify trends, and troubleshoot issues.
With Prometheus and Grafana running, you get:
- Real-time visibility into CPU, memory, storage, and network usage
- Early detection of problems so you can fix them before they get worse
- Better resource allocation based on actual usage data
- Data to help you decide when you need to scale up your infrastructure
Setting Up Monitoring#
Prometheus#
Installation#
There are many options to install, I’ll use one of the official precompiled binaries provided on their dowloads page
So I’ll just download their tar file and extract the downloaded file with the following command.
tar xfvz prometheus.tar.gz -C prometheusFirst, add a new user specific for Prometheus usage
sudo useradd --no-create-home --shell /bin/false prometheusCreate the required directories for Prometheus and change the ownership for them
sudo mkdir /etc/prometheus
sudo mkdir /var/lib/prometheus
sudo chown prometheus:prometheus /etc/prometheus
sudo chown prometheus:prometheus /var/lib/prometheus
Begin by copying the essential Prometheus tools (prometheus and promtool) to their designated locations:
cp prometheus/prometheus /usr/local/bin/
cp prometheus/promtool /usr/local/bin/
Ensure the Prometheus user owns these binaries for proper execution:
chown prometheus:prometheus /usr/local/bin/prometheus
chown prometheus:prometheus /usr/local/bin/promtoolConfiguration#
Use a text editor, (in the case of AlmaLinux, vi comes preinstalled) to create
the Prometheus configuration file:
vi /etc/prometheus/prometheus.ymlAdd configuration: Paste the following configuration details into the file:
global:
  scrape_interval: 10s

scrape_configs:
  - job_name: "prometheus"
    scrape_interval: 5s
    static_configs:
- targets: ["localhost:9090"]- This configuration defines the scraping interval (how often Prometheus collects data) and sets up a job to scrape metrics from the Prometheus server itself (localhost:9090).
Save and adjust ownership: Once you’ve added the configuration, save the file and ensure the Prometheus user owns it:
sudo chown prometheus:prometheus /etc/prometheus/prometheus.ymlSet Prometheus as a Linux service#
Since I want to monitor my cluster anytime, I’ll setup the Prometheus server as a Linux Service using Systemd:
Add this to the file /etc/systemd/system/prometheus.service
[Unit]
Description=Prometheus
Wants=network-online.target
After=network-online.target

[Service]
User=prometheus
Group=prometheus
Type=simple
ExecStart=/usr/local/bin/prometheus \
    --config.file /etc/prometheus/prometheus.yml \
    --storage.tsdb.path /var/lib/prometheus/ \
    --web.console.templates=/etc/prometheus/consoles \
    --web.console.libraries=/etc/prometheus/console_libraries

[Install]
WantedBy=multi-user.target
Apply Changes and Verify Status
Reload systemd: After saving the Prometheus configuration, inform systemd about the changes using:
sudo systemctl daemon-reloadStart Prometheus: Finally, initiate the Prometheus service:
sudo systemctl start prometheus
sudo systemctl enable prometheus
Verify Status: To confirm whether Prometheus is running successfully, check its status with:
sudo systemctl status prometheusBy now, you should have Prometheus running in your VM and accesible from the web
UI on the port 9090.
Grafana#
Installation#
In the case of the Grafana installation, I’m going to use the default package manager to install the OSS version of Grafana:
sudo dnf install grafanaOnce installation is complete, initiate and enable the Grafana server using these commands:
sudo systemctl start grafana-server
sudo systemctl enable grafana-server
The first command starts the service immediately, while the second ensures it starts automatically on system boot.
Confirm that Grafana is running successfully:
sudo systemctl status grafana-serverConfiguration#
Web interface access: With Grafana running, you can access its web interface
at http://<VM IP address>:3000 in your web browser.
Initial login: The default credentials are username: ‘admin’ and password: ‘admin’. You’ll be prompted to change the password upon first login for security reasons.
Advanced configuration (optional): For further configuration (e.g., email
alerts or port changes), edit the /etc/grafana/grafana.ini file using any text
editor :
sudo vi /etc/grafana/grafana.iniMake any necessary adjustments within the file and save your changes.
Prometheus VE Exporter#
We’ll use the Prometheus-pve-exporter to send the metrics from our clusters to our Prometheus Server and from that to grafana
Installation#
Make sure venv is installed (i.e. apt install python3-venv), then prepare a new env for the PVE Exporter:
python3 -m venv /opt/prometheus-pve-exporterInstall PVE Exporter into the new env:
/opt/prometheus-pve-exporter/bin/pip install prometheus-pve-exporterConfiguration#
Previous to running the exporter, we need to create a Proxmox user that the
exporter will use to scrape the metrics. Create a new user under the Datacenter
-> Users section. Fill in the user name, set realm to Proxmox VE
authentication & give it your password.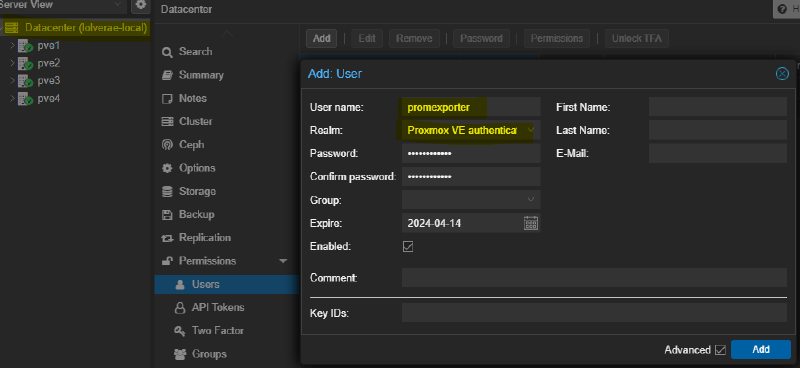
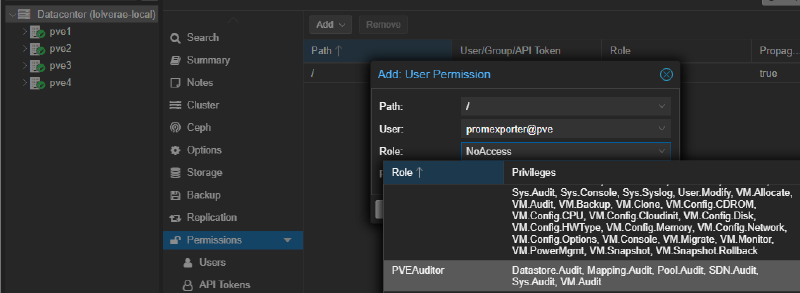
Next, create a configuration file for the exporter: /etc/prometheus/pve.yml In
this file you need to specify the user details from the promexporter user we
just created and we’ll add a flag to skip the verification from the Proxmox
cluster:
default:
  user: promexporter@pve
  password: supersecretpassword
  verify_ssl: false
PVE exporter as Linux Service#
Since I want to monitor my cluster anytime, I’ll setup the PVE exporter as a Linux Service using Systemd:
Add this to the file /etc/systemd/system/prometheus-pve-exporter.service
[Unit]
Description=Prometheus exporter for Proxmox VE
Documentation=https://github.com/znerol/prometheus-pve-exporter

[Service]
Restart=always
User=prometheus
ExecStart=/opt/prometheus-pve-exporter/bin/pve_exporter /etc/prometheus/pve.yml

[Install]
WantedBy=multi-user.target
Apply Changes and Verify Status
Reload systemd: After saving the exporter configuration, inform systemd about the changes using:
sudo systemctl daemon-reloadStart the service: Finally, initiate the PVE exporter service:
sudo systemctl start prometheus-pve-exporter
sudo systemctl enable prometheus-pve-exporter
Verify Status: To confirm whether the Exporter is running successfully, check its status with:
sudo systemctl status prometheus-pve-exporterBy now, you should have the exporter running in your VM and its metrics
accesible from the web UI on the port 9221.
You can access the metrics with curl: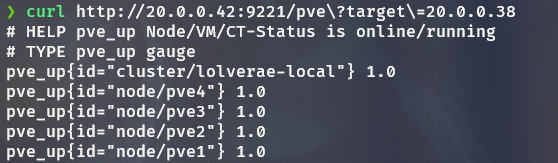
Associating Prometheus with the PVE exporter#
Now, we need to configure the Prometheus server to collect the metrics exposed
by the Proxmox PVE Exporter. To do this we need to edit the Prometheus config
file /etc/prometheus/prometheus.yml
global:
  scrape_interval: 10s

scrape_configs:
  - job_name: "prometheus"
    scrape_interval: 5s
    static_configs:
      - targets: ["localhost:9090"]
  - job_name: "pve"
    static_configs:
      - targets:
          - <IP of node 1> # pve1
          - <IP of node 2> # pve2
    metrics_path: /pve
    params:
      module: [default]
      cluster: ["1"]
      node: ["1"]
    relabel_configs:
      - source_labels: [__address__]
        target_label: __param_target
      - source_labels: [__param_target]
        target_label: instance
      - target_label: __address__
        replacement: <IP from the VM where the exporter is installed>:9221
If everyting is correct, by now you should have the metrics from the Proxmox cluster accesible from your browser:
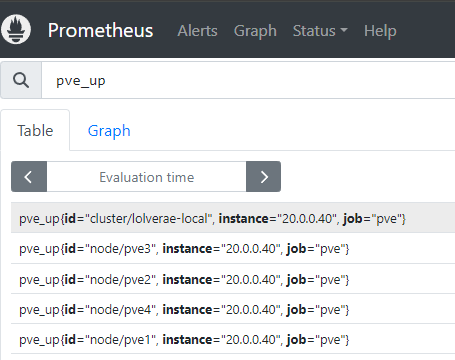
If for some reason you cannot reach any of the addresses we’ve gone trough, I’d
recommend you check your network configuration, in a previous post I talked
about how the firewall config from my AlmaLinux server stopped me from accessing
these sites on my local computer.
Visualizing Proxmox metrics from Grafana#
Once you’ve set up Prometheus and Grafana, the next step is to connect them so Grafana can visualize the metrics collected by Prometheus. Here’s how to achieve this:
Add Prometheus as a Data Source in Grafana:
- Open the Grafana web interface in your browser
- Login using your credentials
- On the left sidebar, click the configuration cogwheel icon and select “Data Sources”.
- Click “Add data source”.
- Choose “Prometheus” as the type.
- In the “URL” field, enter the address of your Prometheus server. If Prometheus
is running on the same machine as Grafana, you can use
http://<Prometheus Server IP>:9090. - Click “Save & Test” to verify the connection. If successful, you’ll see a message confirming connectivity.
Explore and Visualize Metrics:
The fastest way to utilize the metrics is to export a great dashboard that is available to the public.
This dashboard can be imported to our Grafana server and will come preconfigured with helpful charts and tables from our cluster, which will look like this:
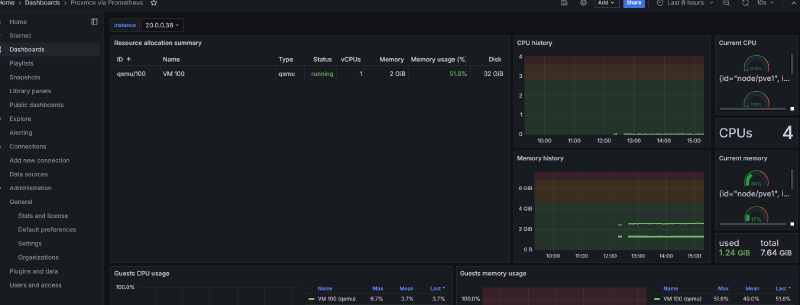
You should now be able to explore the dashboard and monitor your home lab Proxmox setup.